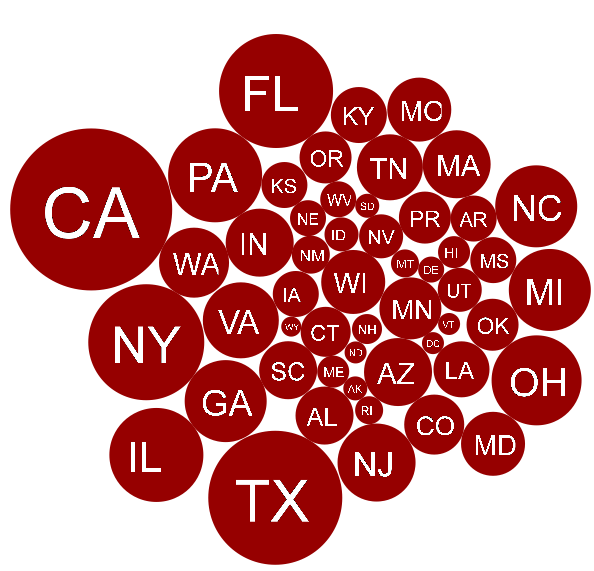
This weekend I taught myself how to use this javascript library MooCirclePack, which allows one to tightly arrange circles of various radii (yes, it was an exciting weekend). Below are the U.S. states, with the area of each circle proportional to the state’s population.
California is, of course, number one.
Moocirclepack only lets you put an image on each circle, and not text, so I had to use the Python pil library (which was a major pain to install) to turn the state abbreviations into images.
The most interesting thing I saw on this graphic is Puerto Rico (PR). Puerto Rico, with a population of 3.7 million, is more populous than 21 other states. It’s almost strange that it isn’t a state (based on population alone).
I do have some things I don’t like about this visualization. The spatial placement of the circles doesn’t mean anything (Oregon is next to Florida). Secondly, our eyes are not very good at comparing area. For instance, it’s hard to tell, by looking at this graphic, that California has a population 10 times that of Puerto Rico (38 million versus 3.7 million).


Hey there, I’m trying to use moocirclepack and ran across your image. It’s the only example I’ve seen of someone successfully placing images onto a circle using this library—would you mind showing me the correct syntax to place in image on the circles?
Thanks!
Hi Jonathan,
The page with the states is here: kroodsma.com/bubbles_states/States.htm. Just look at the page source and you can get the javascript there. I think everything to make it work is in that folder, kroodsma.com/bubbles_states